How to Delete SAS Visual Analytics. save (179.29 MB)
Published by SAS Institute Inc. on 2024-10-17We have made it super easy to delete SAS Visual Analytics account and/or app.
Table of Contents:
Guide to Delete SAS Visual Analytics 👇
Things to note before removing SAS Visual Analytics:
- The developer of SAS Visual Analytics is SAS Institute Inc. and all inquiries must go to them.
- The GDPR gives EU and UK residents a "right to erasure" meaning that you can request app developers like SAS Institute Inc. to delete all your data it holds. SAS Institute Inc. must comply within 1 month.
- The CCPA lets American residents request that SAS Institute Inc. deletes your data or risk incurring a fine (upto $7,500 dollars).
↪️ Steps to delete SAS Visual Analytics account:
1: Visit the SAS Visual Analytics website directly Here →
2: Contact SAS Visual Analytics Support/ Customer Service:
- 100% Contact Match
- Developer: SAS Institute Inc.
- E-Mail: mobilebisupport@sas.com
- Website: Visit SAS Visual Analytics Website
Deleting from Smartphone 📱
Delete on iPhone:
- On your homescreen, Tap and hold SAS Visual Analytics until it starts shaking.
- Once it starts to shake, you'll see an X Mark at the top of the app icon.
- Click on that X to delete the SAS Visual Analytics app.
Delete on Android:
- Open your GooglePlay app and goto the menu.
- Click "My Apps and Games" » then "Installed".
- Choose SAS Visual Analytics, » then click "Uninstall".
Have a Problem with SAS Visual Analytics? Report Issue
🎌 About SAS Visual Analytics
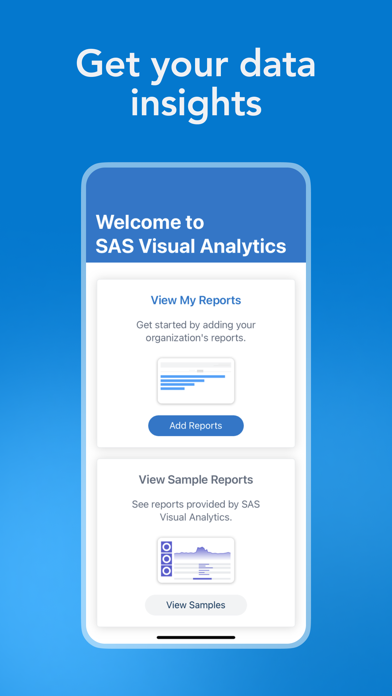
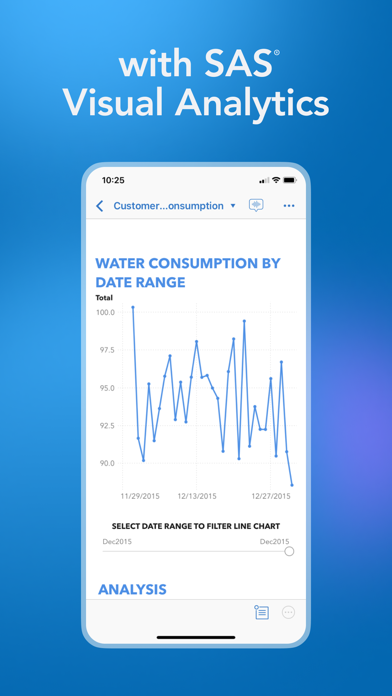
1. SAS® Visual Analytics empowers decision makers with business reports and dashboards anywhere, anytime! SAS® Visual Analytics App, part of the SAS Visual Analytics product family, enables you to view and interact with reports that can contain a variety of charts, graphs, gauges, tables, and other report objects.
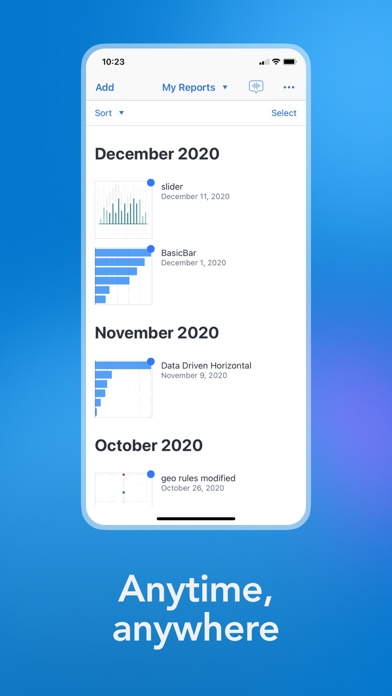
2. With easy-to-use multi-touch gestures, you can move through the application, filter and drill into data in the reports, and make decisions in the office, in meetings, or out on the road.
3. A variety of reports, dashboards, graphs, and gauges provide the customization and flexibility you need to meet your wide range of business demands.
4. Business users can interactively explore vast amounts of data and collaborate with others via the SAS Visual Analytics App.
5. You have the ability to access big data from SAS Visual Analytics.
6. When reports and data change, the app updates the view ensuring users are always up to date.
7. Just as you’d expect – the application provides great response times and a fantastic experience while you work with your reports.
8. Release 8.3 and later, on SAS Viya, are powered by SAS® Cloud Analytic Services (CAS).
9. • Interactive reports, dashboards and graphs.
10. Data access is based on user role and access permissions.
11. Release 7.5 is powered by SAS® LASR(TM) Analytic Server.
12. You can work with reports whether you are connected or not.
13. • Access to big data.
14. You can use familiar gestures, including pinch, zoom, tap, and multi-touch.